The evaluation profile graphically displays the evaluation and times in the course of the game.
View - Evaluation Profile
Another useful piece of help and guidance during the playing through of games integrated into the game is offered by the Evaluation profile which is generated from tactical analysis. The evaluation profile shows graphically during the course of the game the evaluations of the chess engine. Using the evaluation profile below the notation you can recognise at a glance when playing through a game just when it “turned” one way or the other.
The evaluation profile is generated from the tactical analysis and saved along with the game. When you load the game at some later date the profile is available to you and is displayed beneath the notation. The profile is also displayed in those games which you have downloaded from live.chessbase.com.
The evaluation profile offers a graphical view of the use of thinking time and the evaluation of the positions during a game.
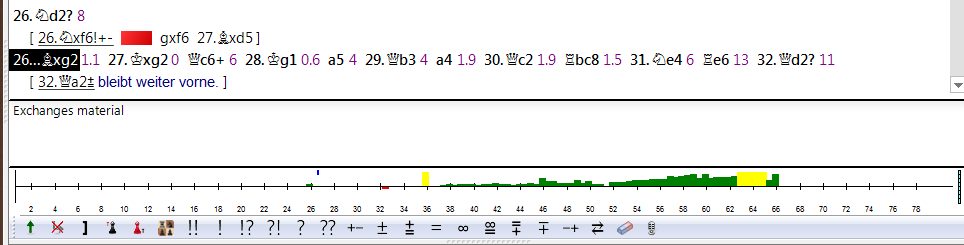
This is how to read the evaluation profile:
Bar above line: advantage for the side at the bottom of the board (i.e. White when the board is in default orientation)
Bar below line: advantage for the side at the top of the board (i.e. Black when the board is in default orientation)
Green bar: advantage for the side at the bottom of the board
Red bar: advantage for the side at the top of the board
Yellow bar: goes beyond the scale of the current window.
The scale is given in “centi-pawns” = 1/100ths of a pawn.
Superimposed in the evaluation profile is the time each side has used.
Blue graph: time used by White
Black graph: time used by Black
The scale is in seconds.
Right clicking on the evaluation offers different views:
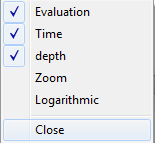
The new option is the „Logarithmic“ view, which becomes useful when the evaluation is a large number, such as +/- 5. When a game is observed which one side has won slowly it is easier to see the progress if the display is non-linear, i.e. small differences remain apparent even if there are large values. The theory behind this is that the difference between +5 and +7 is irrelevant, but the difference between +0.2 and +0.4 is important.
Additional features
 The graph below the horizontal axis gives the search depth of the program.
On the right there is a "thermometer" showing the evaluation graphically.
You can click on the evaluation profile to jump to that position in the game. This is useful if you want to quickly go to the position in the games where the tables turned. There is a little pointer which always shows you where you are in the game (light blue when it is White's turn, gray when it is Black's turn).
You can right-click to hide/show the time and/or the evaluation profile.
Right-click on Zoom to enlarge the display.